This unit, From/To, in our STEAM class Population, we learned about how the animals we see today appeared from lifeforms that used to exist. We learned the differences between natural and artificial selection, and how the genotype or the phenotype of animals can change to better adapt them to their environment. In this Action Project, we chose a set of ten animals and a location that they do not naturally appear in. Then, we had to identify three of those animals that would be most likely to survive in that environment. I decided to choose domestic cats and the Sahara Desert. The parts of this project that I had the most trouble with were the explanations of my math work. I fixed this issue by taking pictures of my work to make it easier for the reader to understand. I loved this project because it was so interesting to think about the adaptations that our ancestors all had to make at some point for us to be here.
 |
| Xena, MDS (2016) |
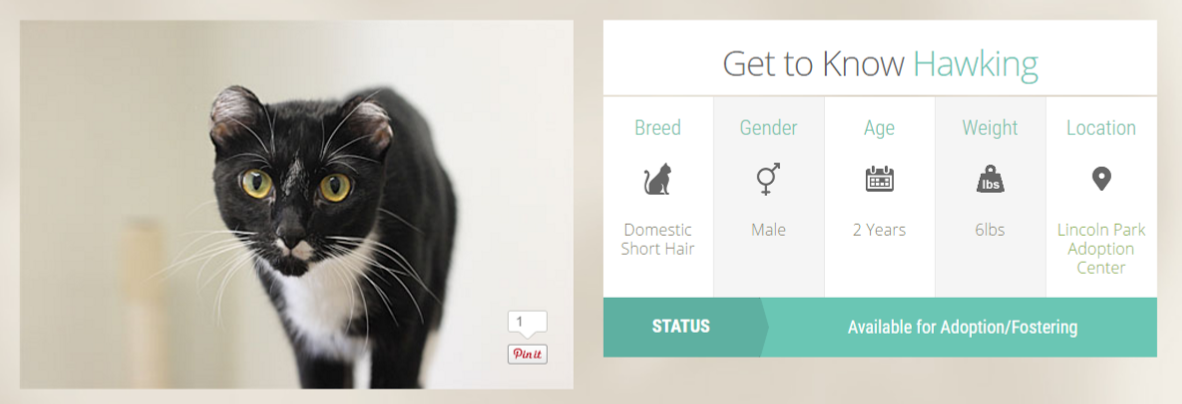
Get to Know Xena
Domestic Short Hair
Female
1 year
6 lbs
 |
| Watney, MDS (2016) |
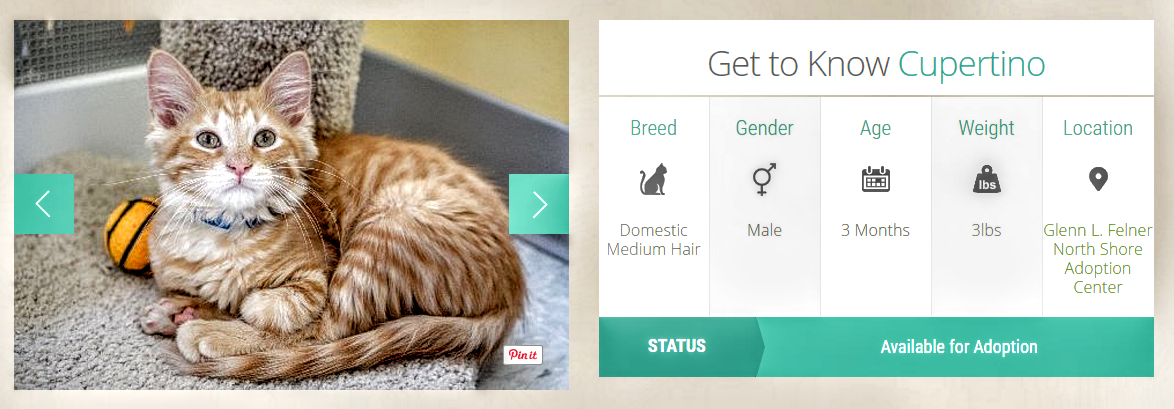
Get to Know Watney
Domestic Short Hair
Male
1 year
13.8 lbs
 |
| Cats' Weights, MDS (2016) |
The work above shows how I found the mean, median(med), mode, maximum, minimum, and range of the cats’ weights. These can be used to analyze the cats and find which are most likely to survive in the desert based on weight. I also calculated the first quartile, third quartile, and the interquartile range (IQR), which are needed to create a box and whisker chart (below) which is easy to read and understand where most weight falls.
 |
| Box and Whisker Plot, MDS (2016) |
 |
Permutation and Combination Work, MDS (2016)
|
|
Above is my math work for finding combination and permutation. They are used to find how many different groups can be found in a population. For this experiment, I would use combination, because with combinations order of the elements in each group does not matter. With permutations, order does matter, and, when finding cats most likely to survive in the Sahara, the order in which I choose the cats does not affect the overall outcome. In this set, there are 120 possible combinations of cats that I could have chosen.
 |
| Standard Deviation, MDS (2016) |
This is my work for finding standard deviation. Standard deviation shows where the majority of the data falls in a set. The standard deviation of this set, 3.45, shows that most of the cats' weights fall between 11.95 (the median, 8.5 added to 3.45), and 5.05 (8.5 minus 3.45)
Works Cited
DesertUSA.com. "The Sahara Desert." Desert USA.
DesertUSA. Web. 12 Oct. 2016.
Society, National. "Domestic Cats." National Geographic Animals.
National Geographic. Web. 12 Oct. 2016.


Comments
Post a Comment